NVIDIA RTX 2000 Ada Generation vs NVIDIA Titan RTX, AI & Machine Learning Comparison
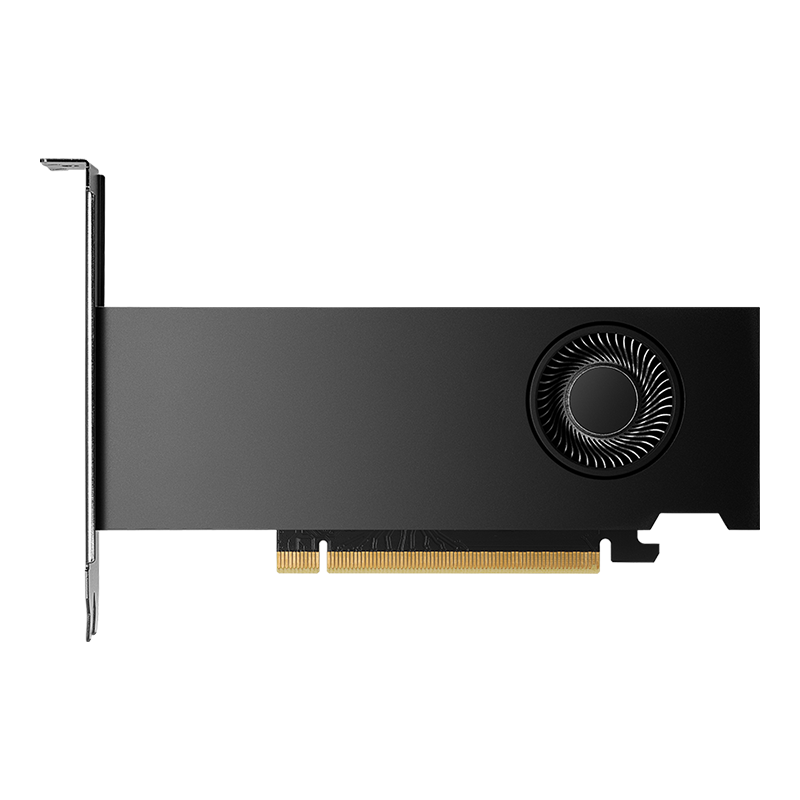
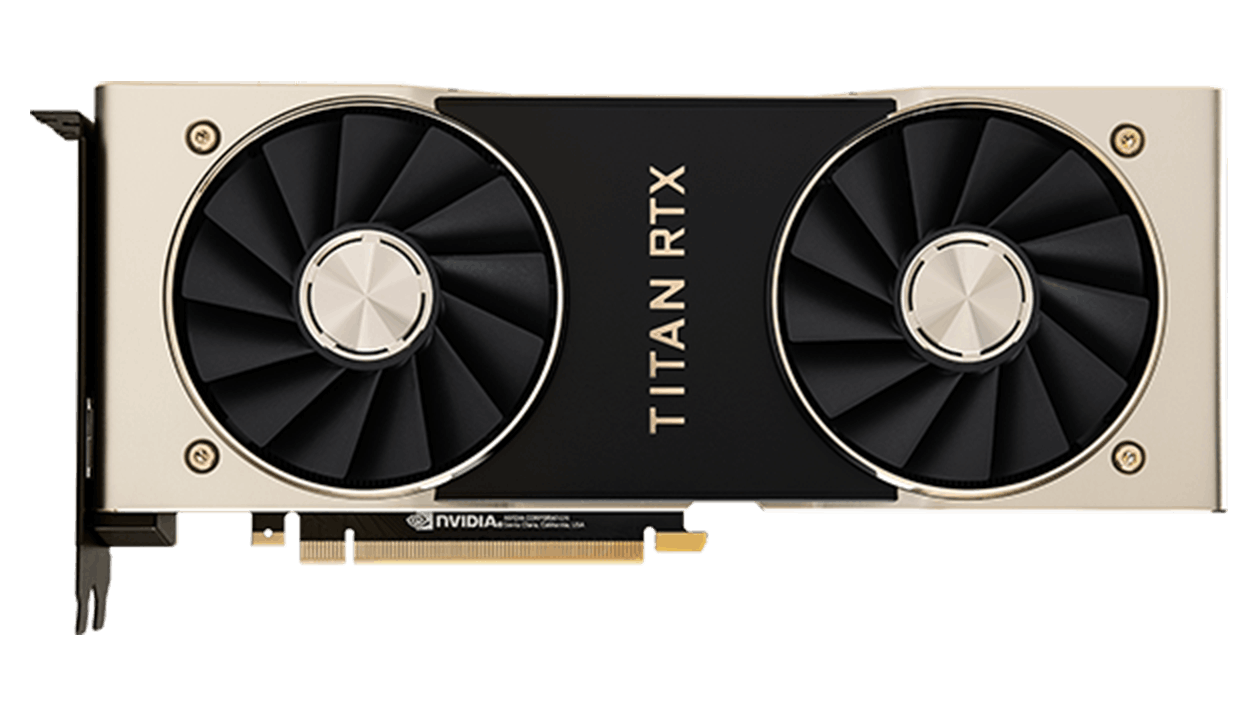
NVIDIA Titan RTX wins 5 of 11 benchmarks, averaging 127.9% faster.
NVIDIA Titan RTX's numbers are anchored estimates calibrated against our measured cards, pending first-party measurement. Treat small gaps as ties.
What the numbers say
The gap is widest in Qwen2.5-Coder 14B, where NVIDIA Titan RTX leads by 156% (23.35 vs 59.75 tok/s); the closest fight is Stable Diffusion XL (83% apart); VRAM decides part of this one: NVIDIA Titan RTX runs 5 of our 12 AI workloads while the other card runs 5, models that don't fit score zero.
Benchmark results head-to-head
| Benchmark | NVIDIA RTX 2000 Ada Generation | NVIDIA Titan RTX | Difference |
|---|---|---|---|
| Qwen3 4B tok/s | 70.88 | 158.13 | -55% |
| Llama 3.1 8B tok/s | 43.08 | 107.39 | -60% |
| Qwen2.5-Coder 14B tok/s | 23.35 | 59.75 | -61% |
| Qwen3 32B tok/s | 0 | 28.36 | n/a |
| Llama 3.3 70B tok/s | 0 | 0 | n/a |
| Stable Diffusion XL images/min | 3.58 | 6.56 | -45% |
| FLUX.1 dev images/min | 0 | 0 | n/a |
| FLUX.1 Kontext dev images/min | 0 | 0 | n/a |
| Qwen-Image-Edit images/min | 0 | 0 | n/a |
| LTX-Video (distilled) frames/s | 1.39 | 0 | n/a |
| Wan 2.2 5B (720p) frames/s | 0 | 0 | n/a |
Whole-job comparison
How long each card takes to finish a complete pipeline, not just one model. NVIDIA RTX 2000 Ada Generation is faster on 0 of 1; NVIDIA Titan RTX on 1.
| Workflow | NVIDIA RTX 2000 Ada Generation | NVIDIA Titan RTX | Difference |
|---|---|---|---|
| Full codebase review | 42.8 min | 16.7 min | NVIDIA Titan RTX 2.56x faster |
Specifications compared
| NVIDIA RTX 2000 Ada Generation | NVIDIA Titan RTX | |
|---|---|---|
| VRAM | 16GB | 24GB |
| Architecture | Ada Lovelace | Turing (TU102) |
| Memory bandwidth | 224 GB/s | 672 GB/s |
| Boost clock | 2,130 MHz | 1,770 MHz |
| TDP | 70 W | 280 W |
| Launch MSRP | $625 | $2,499 |
| Release | 2024-02-12 | 2018-12-18 |
FAQ
- Which is better for ai & machine learning: NVIDIA RTX 2000 Ada Generation or NVIDIA Titan RTX?
- NVIDIA Titan RTX performs better for ai & machine learning, winning 5 of 11 benchmarks in our suite with an average 127.9% advantage.
- What are the main hardware differences between NVIDIA RTX 2000 Ada Generation and NVIDIA Titan RTX?
- NVIDIA RTX 2000 Ada Generation has 16GB VRAM and a 70W TDP, while NVIDIA Titan RTX has 24GB VRAM and a 280W TDP.
- Does VRAM matter more than speed between NVIDIA RTX 2000 Ada Generation and NVIDIA Titan RTX?
- For AI, yes, NVIDIA Titan RTX fits 2 more of our 12 workloads than NVIDIA RTX 2000 Ada Generation. A model that exceeds VRAM doesn't run slower, it doesn't run at all, so the card that fits the model wins that workload outright.
- Where is the biggest performance difference between NVIDIA RTX 2000 Ada Generation and NVIDIA Titan RTX?
- Qwen2.5-Coder 14B: NVIDIA Titan RTX leads by roughly 156% (23.35 vs 59.75 tok/s) in our testing.
NVIDIA RTX 2000 Ada Generation full review · NVIDIA Titan RTX full review · All AI & Machine Learning rankings