NVIDIA GeForce RTX 5090 vs NVIDIA RTX PRO 6000 Blackwell Server Edition, AI & Machine Learning Comparison

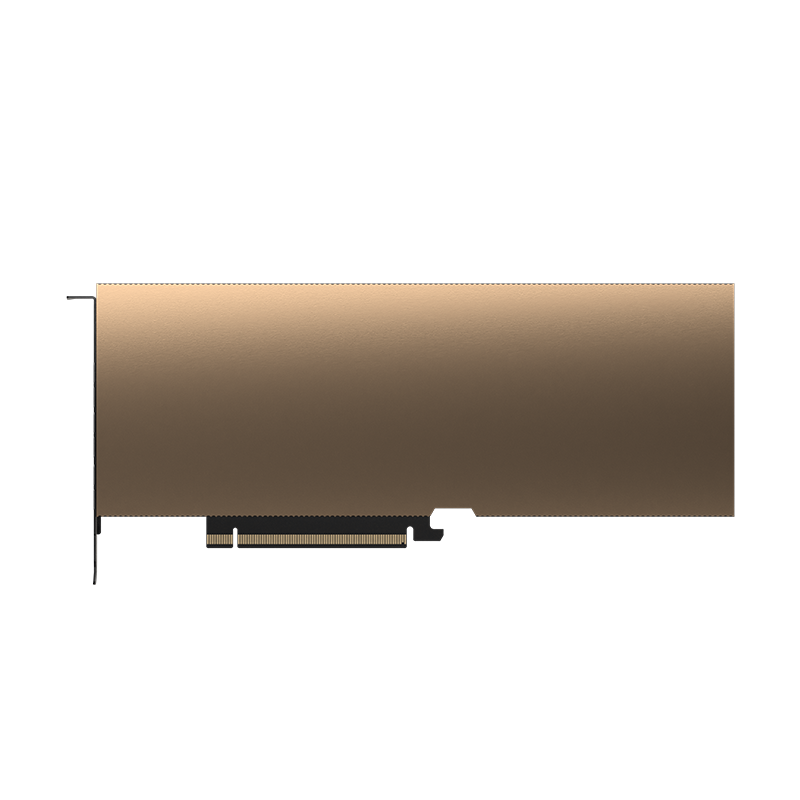
NVIDIA RTX PRO 6000 Blackwell Server Edition wins 5 of 9 benchmarks, averaging 35.1% faster.
Both cards were measured first-party on our bench, same suite, same test rig.
What the numbers say
The gap is widest in FLUX.1 dev, where NVIDIA RTX PRO 6000 Blackwell Server Edition leads by 232% (2.036 vs 6.75 images/min); the closest fight is Qwen2.5-Coder 14B (11% apart); VRAM decides part of this one: NVIDIA RTX PRO 6000 Blackwell Server Edition runs 12 of our 12 AI workloads while the other card runs 7, models that don't fit score zero.
Benchmark results head-to-head
| Benchmark | NVIDIA GeForce RTX 5090 | NVIDIA RTX PRO 6000 Blackwell Server Edition | Difference |
|---|---|---|---|
| Qwen3 4B tok/s | 375.6 | 315.72 | +19% |
| Llama 3.1 8B tok/s | 268.14 | 233.8 | +15% |
| Qwen2.5-Coder 14B tok/s | 149.75 | 135.07 | +11% |
| Qwen3 32B tok/s | 71.15 | 63.9 | +11% |
| Llama 3.3 70B tok/s | 0 | 32.08 | n/a |
| Stable Diffusion XL images/min | 21.08 | 26.32 | -20% |
| Z-Image Turbo images/min | 10.725 | 14.775 | -27% |
| FLUX.1 dev images/min | 2.036 | 6.75 | -70% |
| Qwen-Image-Edit images/min | 0 | 2.62 | n/a |
Whole-job comparison
How long each card takes to finish a complete pipeline, not just one model. NVIDIA GeForce RTX 5090 is faster on 1 of 2; NVIDIA RTX PRO 6000 Blackwell Server Edition on 1.
| Workflow | NVIDIA GeForce RTX 5090 | NVIDIA RTX PRO 6000 Blackwell Server Edition | Difference |
|---|---|---|---|
| Full codebase review | 6.7 min | 7.4 min | NVIDIA GeForce RTX 5090 1.11x faster |
| 24-frame storyboard | 12.5 min | 2.3 min | NVIDIA RTX PRO 6000 Blackwell Server Edition 5.43x faster |
Specifications compared
| NVIDIA GeForce RTX 5090 | NVIDIA RTX PRO 6000 Blackwell Server Edition | |
|---|---|---|
| VRAM | 32GB | 96GB |
| Architecture | Blackwell (GB202) | Blackwell |
| Memory bandwidth | 1792 GB/s | 1792 GB/s |
| Boost clock | 2,407 MHz | 2,610 MHz |
| TDP | 575 W | 600 W |
| Launch MSRP | $1,999 | $8,565 |
| Release | 2025-01-30 | 2025-03-18 |
FAQ
- Which is better for ai & machine learning: NVIDIA GeForce RTX 5090 or NVIDIA RTX PRO 6000 Blackwell Server Edition?
- NVIDIA RTX PRO 6000 Blackwell Server Edition performs better for ai & machine learning, winning 5 of 9 benchmarks in our suite with an average 35.1% advantage.
- What are the main hardware differences between NVIDIA GeForce RTX 5090 and NVIDIA RTX PRO 6000 Blackwell Server Edition?
- NVIDIA GeForce RTX 5090 has 32GB VRAM and a 575W TDP, while NVIDIA RTX PRO 6000 Blackwell Server Edition has 96GB VRAM and a 600W TDP.
- Does VRAM matter more than speed between NVIDIA GeForce RTX 5090 and NVIDIA RTX PRO 6000 Blackwell Server Edition?
- For AI, yes, NVIDIA RTX PRO 6000 Blackwell Server Edition fits 2 more of our 12 workloads than NVIDIA GeForce RTX 5090. A model that exceeds VRAM doesn't run slower, it doesn't run at all, so the card that fits the model wins that workload outright.
- Where is the biggest performance difference between NVIDIA GeForce RTX 5090 and NVIDIA RTX PRO 6000 Blackwell Server Edition?
- FLUX.1 dev: NVIDIA RTX PRO 6000 Blackwell Server Edition leads by roughly 232% (2.036 vs 6.75 images/min) in our testing.
NVIDIA GeForce RTX 5090 full review · NVIDIA RTX PRO 6000 Blackwell Server Edition full review · All AI & Machine Learning rankings